Honeycomb Launches New Service Map, Helping Developers See and Correct Problematic Patterns in Complex Cloud-Native Applications
Honeycomb Launches New Service Map :
Service Map has been launched by Honeycomb, a leading observation platform for cloud applications, along with improvements to its machine analytics tool, BubbleUp. Honeycomb is used to instantly view, evaluate, and improve the quality and performance of cloud services. These developments establish a new benchmark for how quickly and easily developers may analyse the billions of rows of data required to accurately reflect the user experience in today’s complex and unpredictable cloud apps.
Gartner® defines observability as “the characteristic of software and systems that allows them to be understood based on their results and answer questions about their operation. Tools that facilitate software observability allow developers to collect high cardinality telemetry and quickly explore using techniques that iteratively narrow down the possible explanations for anomalousoperation.”
By enabling developers to ask any query regarding the state of their system and receive a response in a matter of seconds, Honeycomb established observability as a substitute for and cutting-edge approach to traditional Application Performance Monitoring (APM) tools. This is impossible with APM solutions because they either abstract crucial data or divide telemetry into distinct data kinds that can only be analysed separately. Developers are compelled to manually determine what they believe is going on as a result. To investigate the telemetry data across their systems as an aggregated whole and all the way down to individual users and transactions, developers can now explore the data using a single user interface and iterative workflow thanks to Honeycomb’s special data storage.
“Technical experts use Honeycomb because they can ask any question about their systems and get an answer in seconds. However, sometimes problems are so complex that it’s not clear what questions to ask”, “With our new Service Map and the improvements we’ve made to BubbleUp, developers have faster access to their systems and easy starting points to start their research.” Christine Yen , CEO and co-founder of Honeycomb.
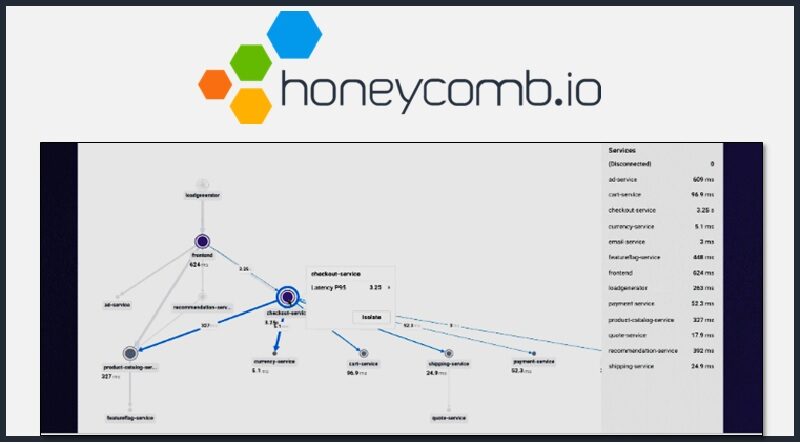
The new Service Map from Honeycomb overcomes the shortcomings of current Service Maps, which typically simply display the topology of services and their relationships and force developers to utilise other tools for exploration and debugging. The brand-new Honeycomb Service Map, on the other hand, is an interactive, visual debugging tool that can be filtered by an infinite number of criteria, giving developers a quick and simple understanding of the connections between all services for particular user classes, usage scenarios, or circumstances like latency or errors. Developers may easily stack subsets of traces throughout the Service Map, which is another distinctive feature that makes faster debugging possible.
“We have hundreds of microservices where it can be intimidating to understand the topology of the system as a whole”, “Honeycomb’s Service Map allows us to visualize our topology and helps us focus on which services in our system are most interconnected.” Zach McCoy , Principal Staff Engineer at Jack Henry™ (Banno).
In addition, Honeycomb has made significant advancements to BubbleUp, enabling developers to debug applications more quickly and accurately by using machine analysis to browse all attributes in billions of rows of telemetry. This allows developers to determine what, in comparison to basic data, is the common factor in problematic data and what explains the context of deviant code behaviour by determining exactly what has changed if they are unsure of which fields to examine or index. By removing the time-consuming and error-prone APM routine of switching from metric dashboards to individual logs and traces and still being unable to pinpoint precisely which patterns are causing problems, this dramatically speeds up the debugging process.
The most recent Honeycomb updates enable developers to leverage a lot more Honeycomb features than only heatmaps. This implies that developers can use BubbleUp’s pattern detection for specific user groups or conditions other than numerical values, such as users from a particular region, who are using specific devices or operating systems, who receive a specific error message, or who use a particular feature of their application. like a promotional code. Because engineers can now look at a wider variety of potential issues through the same user interface, debugging becomes faster and more precise.
Beginning on October 26, 2022, the updated Service Map and upgrades to BubbleUp will be accessible. Through December 31, 2022, Free, Pro, and Enterprise customers will have access to Service Map. After then, only Enterprise customers will have access to it. All Honeycomb subscription tiers will still offer BubbleUp to users. Visit the Honeycomb blog for more articles on Service Map and BubbleUp to learn more about both features.
For More IT News Click Here